German ZEW Survey results Expected On Tuesday
TestThe German ZEW survey is due on Tuesday 16th January and is so far the most awaited news of the first two days of this week’s trading. There is a lot of optimism in play as recent stats also show

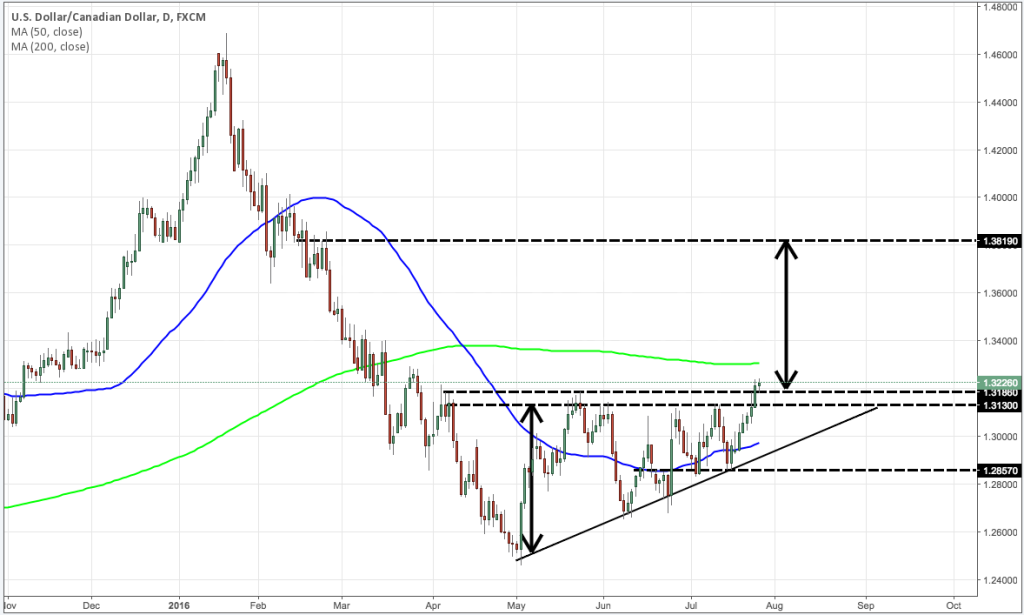
 Long term (Daily) chart of USD/CAD:
TestThe German ZEW survey is due on Tuesday 16th January and is so far the most awaited news of the first two days of this week’s trading. There is a lot of optimism in play as recent stats also show
Test Annualized consumer price inflation (CPI) continued to push higher in November as expected, though core inflation unexpectedly held steady, official data showed on Thursday. U.S. consumer prices moderated in November, but the underlying trend continued to point to firming
Test The jobs market stagnated in the three months to October, according to the latest jobs report from the Office for National Statistics, suggesting employers are finally slowing their hiring in the wake of June’s Brexit vote. The number of
Test Eurozone industrial output dipped in October for the second consecutive month against expectations of a slight rise as production of intermediate and non-durable consumer goods dropped in a sign of muted growth in the fourth quarter according to data
Test U.S. import prices recorded their biggest drop in nine months in November on declining petroleum costs, with renewed dollar strength threatening to keep imported inflation subdued. The Labor Department said on Tuesday import prices fell 0.3 percent last month
Test The Asian Development Bank (ADB) today cut its 2016 growth estimate for India to 7 per cent from the previous 7.4 per cent on account of demonetization, weak investment and agricultural slowdown. The ADB had, in March last year,