GBP/USD gathered renewed momentum and extended to fresh 2-week highs above 1.3300 during the American afternoon, as the dollar trades lower across the board. However, investors might be reluctant to push Cable higher ahead of the Bank of England policy decision on Thursday, with consensus looking for a 25 bps rate cut, while some analysts expect the bank to expand their bond purchases by £50 billion to £425 billion. The BOE monetary policy stance would now be one of the most important factors that would drive cable in the near-term. Once the incoming data flow confirms actual economic fall-out, BOE will opt to aggressively ease its monetary policy and could also decide on expanding its quantitative easing (QE) program during the later part of 2016.
So far this year the British Pound has weakened over 10% against the US Dollar and tested its worst levels in more than three decades. Majority of the year-to-date losses were recorded on the day when British voters decided that UK should end its 43 year old association with the European Union (EU). UK will continue to be a part of EU as the actual process would take a minimum of two years, Theresa May, has indicated that the process will not kick-off before the end of 2016 (Brexit). Analysts explained that the relatively stronger US growth against the backdrop of a sluggish global growth story has been the key to the strong rise in interest rate differentials in the USD’s favour and the USD’s 20% rise since mid-2014. But, tentative signs are emerging that the US’ growth “leadership” position in the global economy is fading. Both sides of the equation seem to be at work - less weak activity overseas and weaker headline GDP growth in the US.
At its meeting in July, FOMC left interest-rates unchanged but has set the stage for a potential rate-hike in September. Despite of a weaker-than-expected advanced GDP number for the second-quarter of 2016, the US economy has been showing signs of strength of late. The upcoming US Presidential election on November 8th might add to the level of economic uncertainty but with strong labor market performance, which has been an important pillar of strength for the US economy, rising wages would now trigger a faster pace of inflation and revive hope of a Fed rate-hike decision later during this year.
Technical analysis
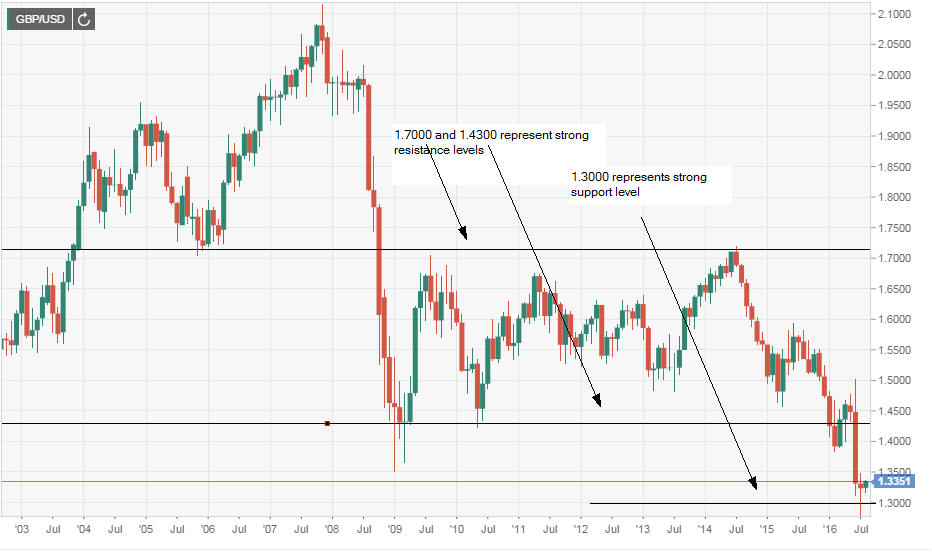
When we look at the monthly chart of this pair ( 12 years period) we can see strong " bearish" correction. On this monthly chart I marked support and resistance levels, 1.7000 and 1.4300 are long term resistance levels, 1.3000 represents strong support level. As long the price is below 1.4300 resistance level there is no indication of long trend reversal and this pair is in the "sell" zone ( there could be a short term jump but first "BUY" signal would be if the price jumps above 1.4300 level).
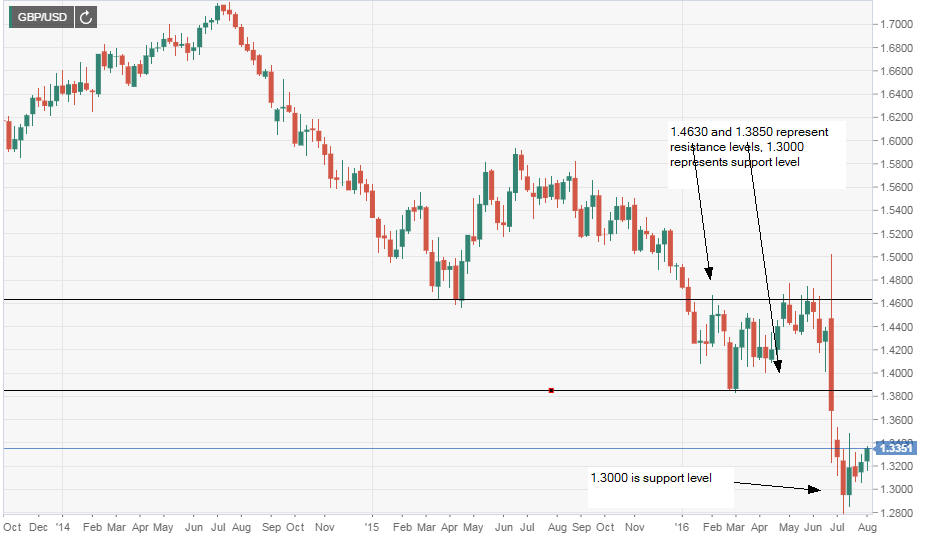
On this weekly chart we can also see that major trend is "bearish", price has dropped from 1.7000 level to 1.2796 level ( this level also represents strong support). On this chart I marked support and resistance levels, 1.4630 and 1.3850 represent resistance levels, 1.3000 represents strong support level. At the end of the chart we can see "bullish" candles, this could be indication that GBPUSD could raise more ( short term traders could find good "long" position on 15 min chart but short term traders should trade with "stop loss" and "take profit" orders, 1.3500 and 1.3600 could be "bullish"targets).
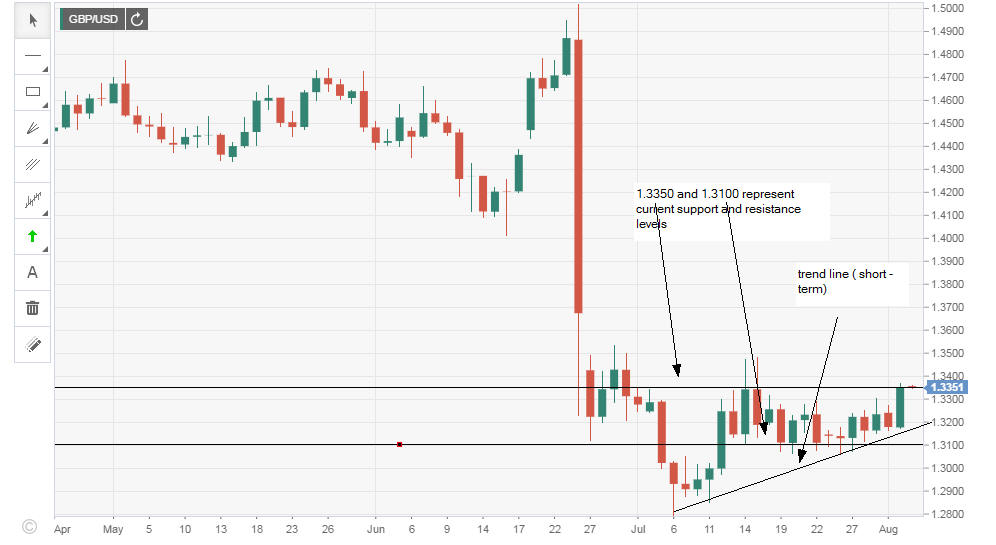
On this daily chart we can see that GBP/USD bottomed at 1.2796 and after that returned above 1.3000 level ( psychological support level). Breaking below 1.3100 would open way to 1.3000, 1.2796 and than to 1.2700 level, breaking above 1.3500 level would open way to 1.3850 level (positions for short term traders). At the end of this chart we can see chart pattern "inverted head and shoulders", this pattern could be a indication of trend reversal. The GBPUSD is fundamentally bearish, investors might be reluctant to push Cable higher ahead of the Bank of England policy decision on Thursday, with consensus looking for a 25 bps rate cut, while some analysts expect the bank to expand their bond purchases by £50 billion to £425 billion. At its meeting in July, FOMC left interest-rates unchanged but has set the stage for a potential rate-hike in September. Technically speaking short term trend of this pair is bullish and as long the price is above short term trend line there is no indication of short term reversal.